Get Started
Contents
Get Started#
In this section, we will see how to perform a diagnostics experiment.
NOTE: At the end of each diagnostics test, the resulting log is automatically transferred to a remote server. If the diagnostics tool fails to transfer the log to the server, the tests data will be lost and the test need to be run again.
Run a (single test) diagnostics experiment#
You can run a diagnostics test for 60 seconds on the target
device [ROBOT] with the command
dts diagnostics run -H [ROBOT] -G my_experiment -d 60
Let the diagnostics tool run until it finishes. A successful experiment concludes with a log similar to the following:
. . .
[system-monitor 00h:00m:55s] [healthy] [8/8 jobs] [13 queued] [0 failed] ...
[system-monitor 00h:00m:58s] [healthy] [8/8 jobs] [13 queued] [0 failed] ...
INFO:system-monitor:The monitor timed out. Clearing jobs...
INFO:system-monitor:Jobs cleared
INFO:system-monitor:Collecting logged data
INFO:system-monitor:Pushing data to the cloud
INFO:system-monitor:Pushing to the server [trial 1/3]...
INFO:system-monitor:The server says: [200] OK
INFO:system-monitor:Data transferred successfully!
INFO:system-monitor:Stopping workers...
INFO:system-monitor:Workers stopped!
INFO:system-monitor:Done!
The most important thing to look for is the line
INFO:system-monitor:The server says: [200] OK
which indicates that the diagnostics log was successfully transferred to the remote diagnostics server.
Visualize the results#
The diagnostics server collects diagnostics logs and organizes them according to the given group, subgroup and hostname of the target machine of each test.
To check the outcome of a diagnostics test, open your browser and navigate to https://dashboard.duckietown.org/diagnostics. Tests will be available on this page a few seconds after the upload is complete.
Use the dropdowns Group and Subgroup to find your experiment and test.
Remember, when the subgroup is not explicitly specified with the argument
-S/--subgroup, default is used.
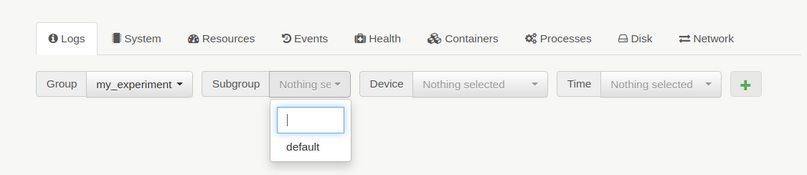
Fig. 20 Selecting diagnostics test on dashboard.duckietown.org#
Use the tabs System, Resources, etc. to see the content of the diagnostics log.
One experiment, many tests#
In many cases, your experiment is that of comparing two or more
configurations or implementations of part of your system.
In these cases, you need to run multiple tests as part of a single
experiment. The diagnostics tool allows you to declare a group
(-G/--group) and a subgroup (-S/--subgroup) when you run a test.
Use the group argument to name your experiment and the subgroup to
name the single tests.
Let us recall the example of Running example.
We want to measure the effects of changing the drivers frequency on the system,
so we run (and monitor) the system twice, a first time with the frequency tuned
at 20Hz, and a second time with the frequency at 30Hz.
We call the overall experiment camera_frequency and the two tests,
20hz and 30hz respectively.
We can use the following commands to run the two tests described above, one
before and the other after applying the change to the camera drivers code.
dts diagnostics run -H [ROBOT] -G camera_frequency -S 20hz -d 60
dts diagnostics run -H [ROBOT] -G camera_frequency -S 30hz -d 60
We can now use the Diagnostics page available at https://dashboard.duckietown.org/diagnostics. to visualize both tests side by side. Similarly to what we have done in Visualize the results, we will use the dropdown buttons to select our tests and add them to the list. Once we have both on the list, we can move to the other tabs to see how the results of the two tests compare.