Get Started with Diagnostics
Contents
Get Started with Diagnostics#
What you will need
dtsinstalled on your base station and reachable Duckiebot hostname
What you will get
Run a 60-second diagnostics capture, verify upload, and locate the log online
Warning
This feature is currently unavailable.
1 – Run a single-test experiment#
Execute a \(60s\) capture on robot [ROBOT]:
dts diagnostics run -H [ROBOT] -G my_experiment -d 60
Leave the session running until it terminates. A successful run ends with:
...
INFO:system-monitor:Pushing data to the cloud
INFO:system-monitor:Pushing to the server [trial 1/3]...
INFO:system-monitor:The server says: [200] OK
INFO:system-monitor:Data transferred successfully!
...
The line The server says: [200] OK confirms that the log reached the remote server.
If the upload fails, the data are discarded and the test must be repeated.
Visualize the results#
Open https://dashboard.duckietown.com/diagnostics.
Logs are indexed by Group, Subgroup, and hostname.
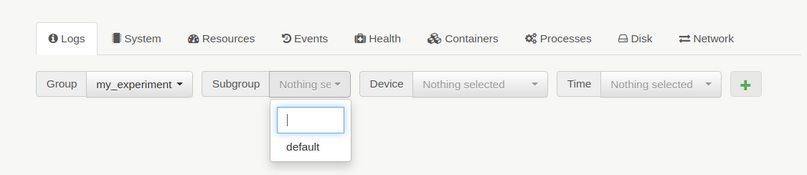
Fig. 19 Selecting diagnostics test on dashboard.duckietown.com#
Tip — if no -S/--subgroup was supplied, the entry appears under default.
One experiment, many tests#
When comparing configurations, run several tests inside one experiment using the -S/--subgroup flag.
Example from Running example:
# baseline at 20 Hz
dts diagnostics run -H [ROBOT] -G camera_frequency -S 20hz -d 60
# pushed to 30 Hz
dts diagnostics run -H [ROBOT] -G camera_frequency -S 30hz -d 60
On the Diagnostics page, select both 20hz and 30hz subgroups under Group = camera_frequency and compare the plots across the System, Resources, and other tabs.