Operation - Use the Dashboard
Contents
Operation - Use the Dashboard#
This section shows how to use the Duckietown Dashboard on the Duckiebot.
What is in the Dashboard?#
The following video provides a brief tour of the most important features of the Duckietown Dashboard on your Duckiebot.
To see all the available dashboard components, you will need to first log in. Once logged into the dashboard, you will see a navigation panel down the left side of the page. The 7 available subpages are:
PAGE NAME |
DESCRIPTION |
|---|---|
Portainer |
A nice GUI tool for seeing all containers running on a Duckiebot |
File Manager |
A file manager for managing the files on the robot |
Robot |
A summary page for the robot status |
Profile |
Information for your duckietown account |
Package Store |
A package store contain all available packages for your Duckiebot |
Users |
Advanced Feature: Allow multiple students to use one Duckiebot |
Settings |
Advanced Feature: Change configuration of your Duckiebot dashboard manually |
Restful API |
Advanced Feature: Documentation to the RestAPI exposed by the Dashboard. |
Let’s dive into a few pages that you will need to get started.
The Robot Page#
In this page you will find several tabs that help you see and understand the status of your Duckiebot. The default tab is Info.
Robot - Info#
In this tab, you can find information for your robot - including your robot name, type, configuration, and critical information such as CPU usage, temperature, and other crucial robot vitals.
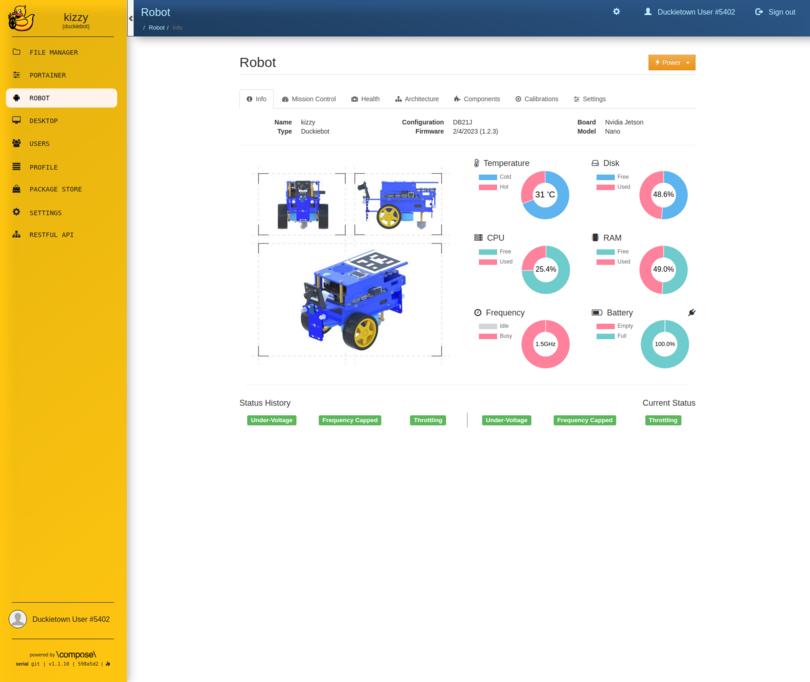
Note
From this page you can read the Duckiebot’s firmware version, i.e., the version of the base image used during initialization.
Robot - Mission Control#
This is the Mission Control tab.
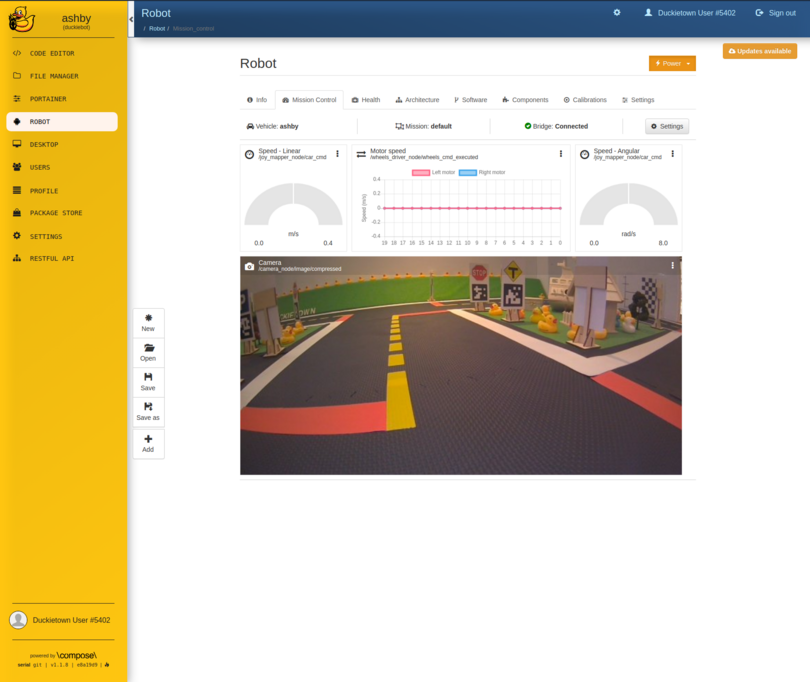
In this tab you can see what the Duckiebot sees via the iamge stream, the lateral and angular speed of your robot, and a plot of left and right motor speed. This is the tab that lets you monitor and control your Duckiebot.
Tip
The page contains 4 blocks by default. Feel free to drag them around and rearrange them as you please. You can also use the menu button of each block to resize them.
Troubleshooting
SYMPTOM
I do not see the camera image on the dashboard.
RESOLUTION
This could be caused by a few issues. Make sure you are accessing the dashboard using http://ROBOT_HOSTNAME.local/ instead of directly accessing the dashboard using robot IP address. Make sure the lens cap has been removed from your camera. If you still don’t see an image, jump to the Operation - Make it See page for more debugging options.
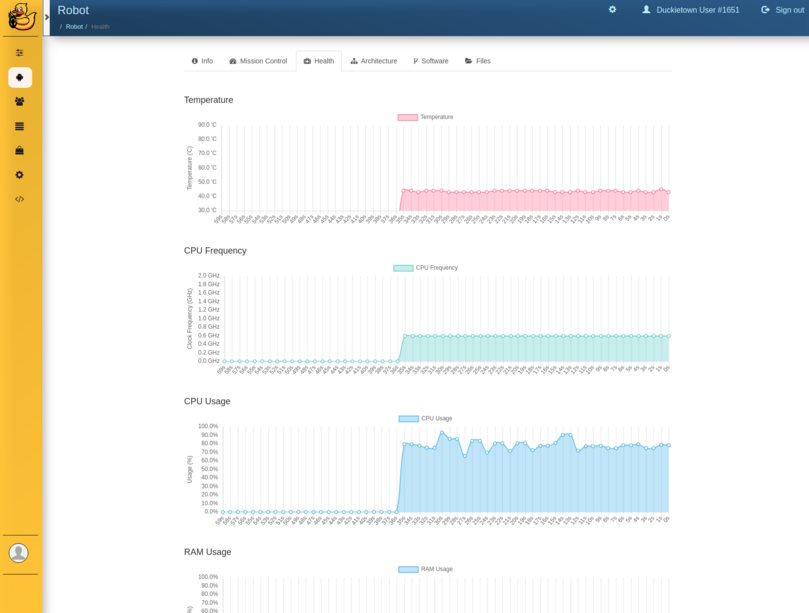
The Health Page#
This is the Health Page. It will show you a plot of the robot’s health status such as temperature, frequency, and CPU usage. It is a good debugging tool to watch your code’s resource usage.
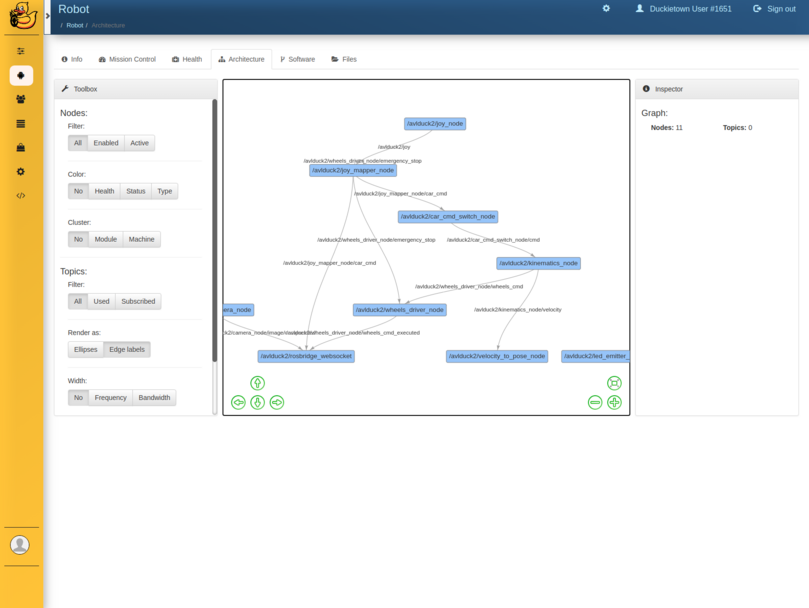
The Architecture Page#
This is the Architecture Page. It will allow you to visualize all the published ROS topics and see their details. It is a useful tool to see what is running and what is not. You can also use this tool as a replacement of rqt-graph. For more instructions on rqt-graph, you can see it here
The Portainer Page#
Portainer is a provided tool for managing all the docker containers that are running on the Duckiebot. Using portainer tools, you can quickly see the status of the containers on your Duckiebot.
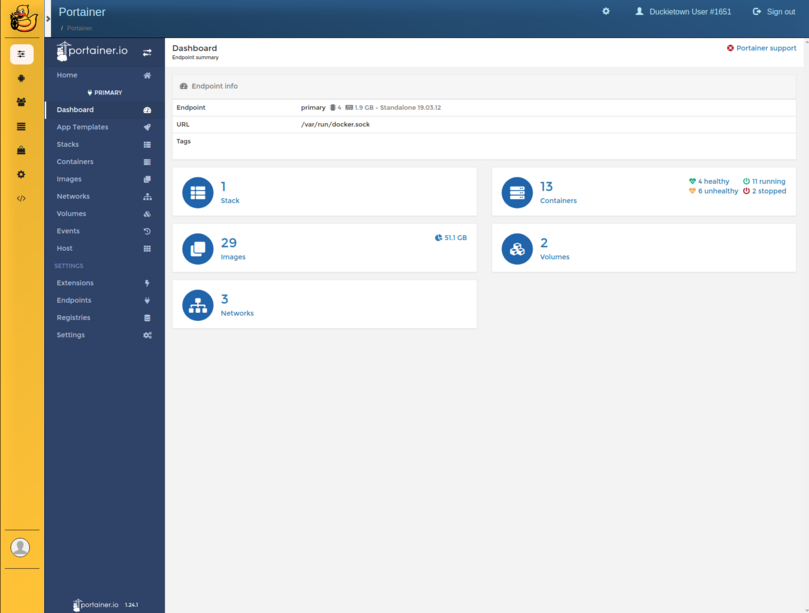
You can select containers to see all the containers on the Duckiebot.
For more information about portainer, you can find them in this page.