Operation - Software Tools
Contents
Operation - Software Tools#
This section describes how to use available software tools for your Duckiebot including the start_gui_tools interface, ROS tools, and the no-vnc Desktop interface.
Using start_gui_tools#
If you are familiar with how ROS works and like using the command line interface, you can run:
dts start_gui_tools ![DUCKIEBOT_NAME]
to obtain a terminal (container actually) that is connected to the Duckiebot ROS network. In this terminal you can perform all ROS commands and have access to all ROS messages streaming on your Duckiebot.
Attention
Note again that in these commands you input the Duckiebot hostname; do not include .local part.
Warning
You can only start one instance of the start_gui_tools container. If you want multiple terminal instances, it is recommended to use no-vnc.
Starting no-vnc images#
If you would rather use an image that runs no-vnc to provide you with a Desktop environment connected to the Duckiebot, type:
dts start_gui_tools --vnc ![DUCKIEBOT_NAME]
To use no-vnc, use your browser and navigate to:
http://localhost:8087/
You can treat this environment as a typical Ubuntu machine with ROS installed and configured to talk with your Duckiebot. Click on the Terminal Desktop icon to open the command line interface.
Using the ROS utilities#
Once you’ve opened a terminal connected to the Duckiebot container using one of the two methods above, you can use any of the commands below within that interface to check the data streams in ROS.
List topics#
You can see a list of published topics with the command:
rostopic list
See also: For more information about rostopic, see the official ROS wiki here.
You should see at least the following topics:
/![DUCKIEBOT_NAME]/camera_node/camera_info
/![DUCKIEBOT_NAME]/camera_node/image/compressed
/rosout
/rosout_agg
There might be other topics if you have already started other demos.
Show topics frequency#
You can use rostopic hz to see the statistics about the publishing frequency:
rostopic hz /![DUCKIEBOT_NAME]/camera_node/image/compressed
On a Raspberry Pi 3, you should see a number close to 30 Hz:
average rate: 30.016
    min: 0.026s max: 0.045s std dev: 0.00190s window: 841
Use Ctrl-C to stop rostopic.
Show topics data#
You can view the messages in real time with the command rostopic echo:
rostopic echo /![DUCKIEBOT_NAME]/camera_node/image/compressed
You should see a large sequence of numbers being printed to your terminal.
That’s the “image” - as seen by a machine.
rqt_image_view tool#
To see what your Duckiebot sees, you can run
rqt_image_view
The command will open a window where you can view the image.
You will have to select the camera_node/image/compressed topic from the drop-down menu:
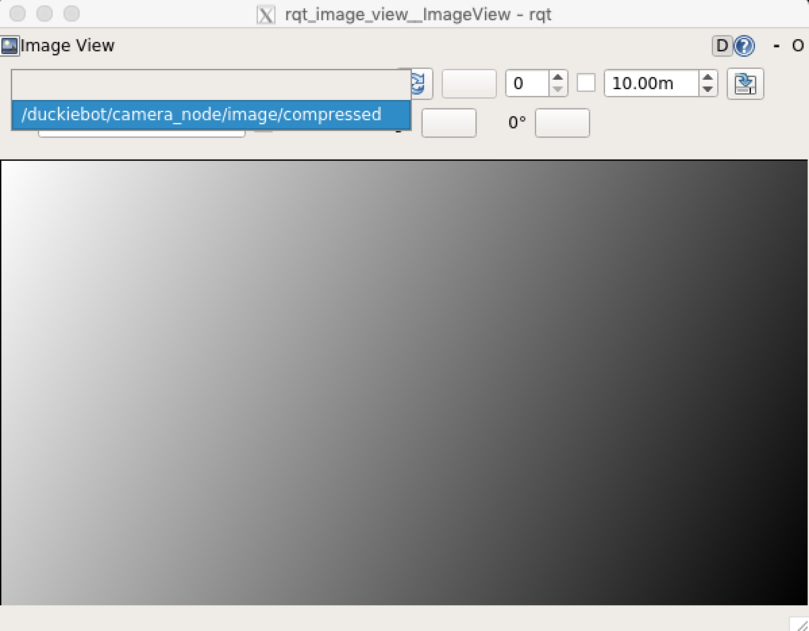
Fig. 48 The rqt image view window with dropdown menu - select the camera_node/image/compressed topic.#
Or if you are using the no-vnc interface, click on the RQT Image View application icon on the desktop. You will see the same rqt_image_view interface start up
rqt_graph tool#
If you want to explore the relationship between all the nodes, topics and tf, you can open up a terminal and run:
rqt_graph
This will open up a window that contains all the ROS topics being published, all the ROS nodes running, and it is a very handy tool to understand the relationship between nodes.
ROS Troubleshooting#
Troubleshooting
SYMPTOM
My ros commands are not working. I cannot use tab to auto complete ROS commands.
RESOLUTION
You can fix that by sourcing devel/setup.bash
source /code/catkin_ws/devel/setup.bash
Troubleshooting
SYMPTOM
I cannot connect to ROS master.
RESOLUTION
Go to Dashboard > Portainer to make sure the following containers are running without errors:
ROS
car-interface
duckiebot-interface
If they are not running, refer to Docker troubleshooting for instructions to resolve the issue.